
COVID WarRoom has been designed to aid in the development of re-opening strategies as we begin the re-opening process. Presently, COVID WarRoom allows the user to select a location for analysis, and then define the parameters by using one of our four predefined Social Distancing models: Linear Auto-SD, Linear Default-SD, Quadratic Auto-SD, and Quadratic Default-SD. (For additional information on our Social Distancing Models see section entitled ‘Social Distancing Models’ below.)
Once the user selects their parameters they will be presented with a three-column layout depicting their specified analysis:
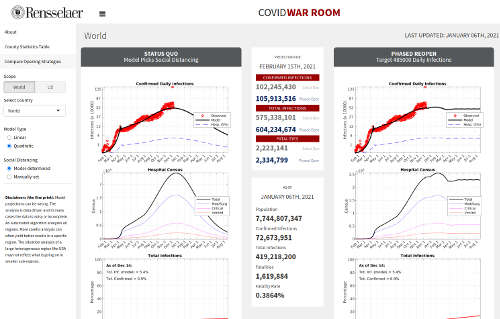
- Column 1: Status Quo
- The first column shown contains a series of graphs using the current social distancing metric being implemented in the selected location. (See subsection entitled ‘Status Quo’ below for additional information.)
- Column 2: Descriptive Statistics
- The second column has two parts: The top-half shows the descriptive statistics for the location that the user selected as of the date that the analysis was last performed. The bottom-half shows a comparison of the predicted descriptive statistics for the area using a pre-defined date. The date of analysis and the predefined prediction date can be found in the text displayed above each of the tables respectively.
- Column 3: Phased Reopening
- The third column contains a series of graphs using the social distancing model that the user selected when defining their parameters.
Disclaimers: Model projections can be wrong. The analysis is data driven and in many cases the data is noisy or incomplete. An automated algorithm analyzes all regions. More careful analysis can often yield better results in a specific region. The situation analysis of a large heterogeneous region like USA may not reflect what is going on in smaller sub-regions.
- PLEASE NOTE: This application is the result of the efforts of students at Rensselaer’s Data INCITE Lab. It is presented here to showcase the talents of our students. The application may not meet all of the standards one might expect of a production commercial product.
- COVID WarRoom live app: https://inciteprojects.idea.rpi.edu/apps/warroom/
- COVID WarRoom github repository: https://github.rpi.edu/DataINCITE/IDEA-COVID-WarRoom