Project Gallery
Mars Mission Minder
Integrated, interactive data analysis of the Mars 2020 mission
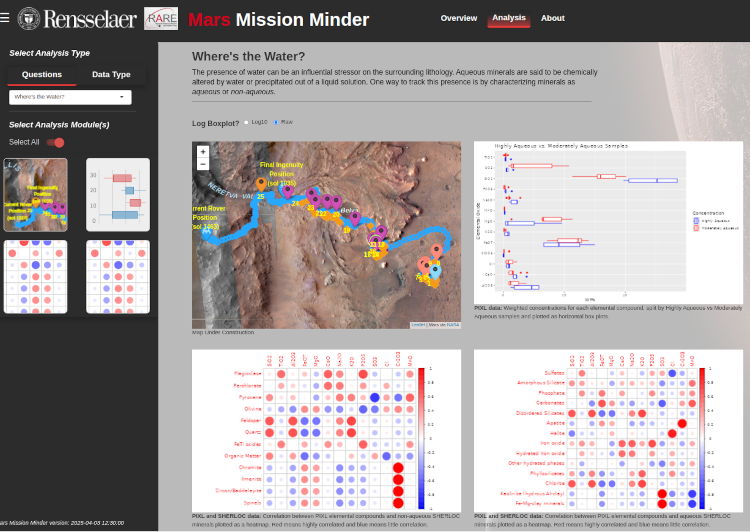 Mars Mission Minder is a data visualization and analysis application designed to support NASA's Mars missions, currently focused on the Mars 2020 Perseverance Rover. The app enables users to analyze three key datasets: PIXL (Planetary Instrument for X-ray Lithochemistry), LIBS (Laser Induced Breakdown Spectroscopy), and SHERLOC (Scanning Habitable Environments with Raman & Luminescence for Organics and Chemicals). These datasets provide insights into elemental composition, mineral abundance, and potential biosignatures on Mars. Analytical tools such as heatmaps, principal component analyses, and ternary diagrams help visualize the data, while Mars Explorer, an interactive map, tracks the rover's path and data collection sites.
The Floating Solar Explorer
Visualizing the energy-generation opportunities and potential economic impact of adopting floating solar on human-made water reservoirs
The Rensselaer IDEA-developed Floating Solar Explorer app helped the City of Cohoes, NY win a one-of-a-kind economic development grant, announced in May 2022.
BlockIoT
 BlockIot is an interoperable, and decentralized way to connect medical IoT devices and health records systems systems.
HEALS
Health Empowerment by Analytics, Learning, and Semantics
The HEALS project applies advanced cognitive computing capabilities to help people understand and improve their own health conditions. In particular, we are exploring areas including personalized and mobile medical care, improved healthcare analytics, and new data-based approaches to driving down the cost of medical care.
SCALES
Smart Contracts Augmented with LEarning and Semantics
SCIENCE with Blockchain
This is a research project to develop a trustworthy, accountable, data sharing eco-system for biomedical research that utilizes knowledge representation and blockchain technologies to address the challenge of the costly and time-consuming effort needed to bring a biomedical innovation from the bench (basic research) to bedside (clinical level).The Data INCITE Lab
Data Informatics Challenges in Technology Education
 The Rensselaer Data INCITE pipeline for undergraduate data science education consists of an early data analytics course followed by applied data science research experiences on real-world problems. Data INCITE results in data science skills and prompts students to pursue further coursework and careers in data science.
The RPI Mars Data Explorer
Mars 2020 on the Campfire: An Interactive Data Visualization and Analysis Platform
 The Mars Data Explorer aims to transcend traditional data presentation methods by integrating this geolocated, multi-faceted dataset atop an interactive map that traces the rover’s journey across the Martian landscape. Our platform significantly reduces the time from acquisition of raw data to its interactive visualization, enabling immediate insights and fostering a dynamic environment for scientific discovery. By leveraging cutting-edge data analytics techniques and sophisticated visualization tools, our project offers a comprehensive and intuitive exploration of the chemical and mineralogical composition of Mars’ surface. The interactive map not only contextualizes the spatial distribution of analyzed samples but also enables users to engage with the data in an immersive way. Users can select and zoom into specific sampling and analysis locations along Perseverance’s path, access detailed analyses from SHERLOC and PIXL, and visualize comparisons across datasets and samples for real-time data exploration Our approach emphasizes the combination of analytical rigor with dynamic visualizations for deeper data exploration and hypothesis testing in a visualization-enabled, group contribution environment. This process accelerates discovery, fosters cross-disciplinary collaborations, and serves as an example for ongoing and future astrobiology and planetary science missions. “Mars 2020 on the Campfire: An Interactive Data Visualization and Analysis Platform” project highlights the transformative power of data visualization and analytics and how the addition of these tools can change the dynamics of interdisciplinary collaboration in science.